Viral content is not always something that happens by chance – there are ways to impress your audience so that they are compelled to share your content. It’s time to incorporate data …. big data!
In this post, we’re going to share 11 sources for statistics and studies you can use when creating content that has the best shot of becoming “viral content”.
Creating viral content is a mix of art and science. Research has shown that one of the key reasons behind virality is that the content is data-driven.
Whether you want to create a simple image for a Facebook post or a comprehensive infographic, the right facts and figures will capture your audience’s attention, wow or educate them, and inspire them to share with their friends.
How to Use Statistics in Viral Content
Before we dive into the resources you can tap into, let’s look at some ways you can incorporate research and studies into your viral content.
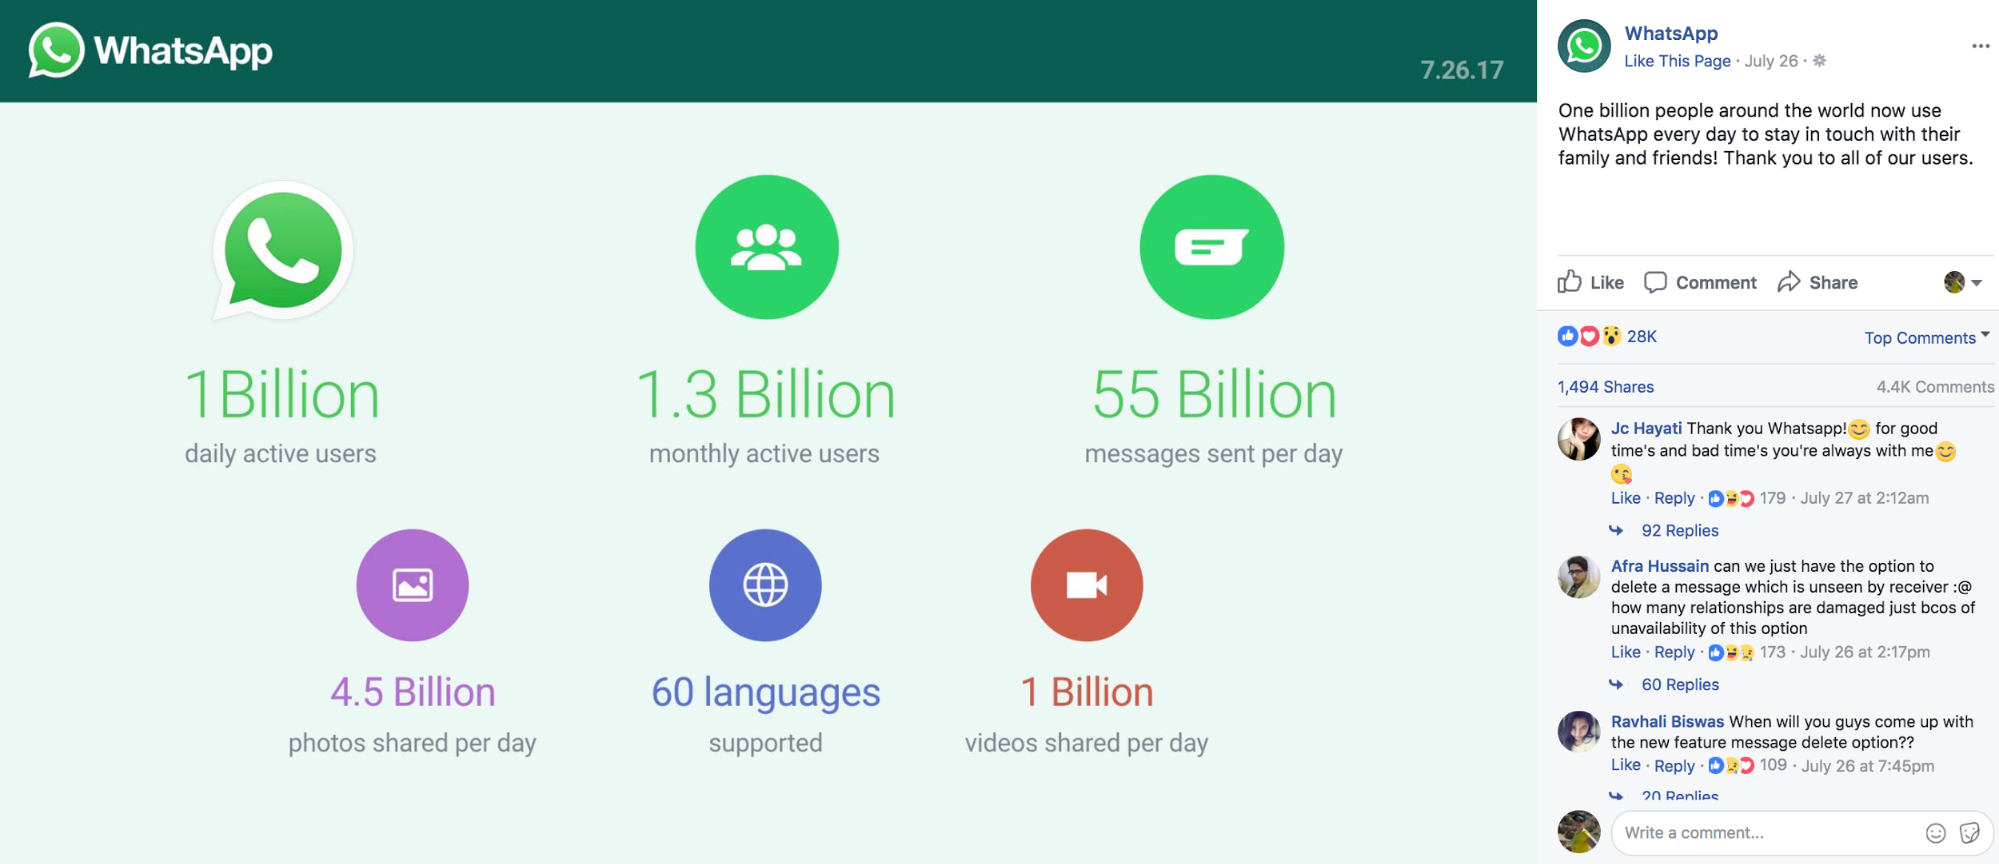
For starters, you can impress people by showing them how many use your product or service:
You can show people what customers use your products and services for:

You can inspire people to use your product or service with a benefit backed by science:

You can amuse people with stats you discover:
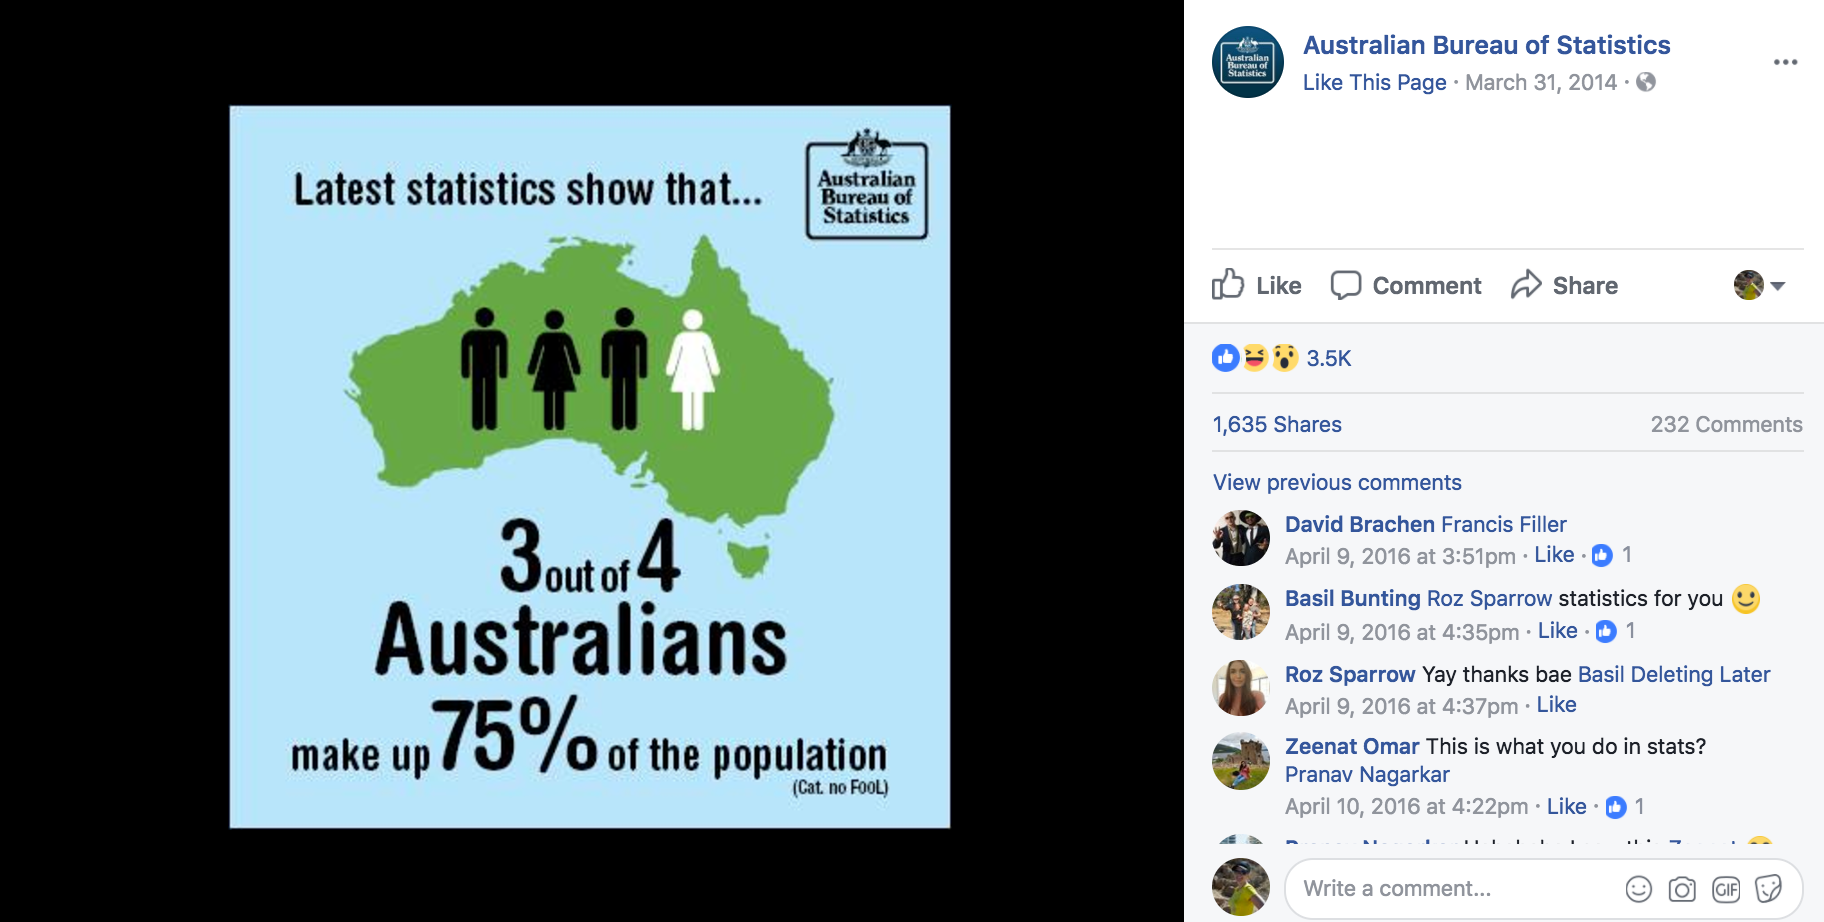
Well…. look at that, the Australian Bureau of Statistics is actually quite fun! See Tip #3 below.
You can prepare your audience for danger:

You can educate people about facts that will make them want to take action.

In addition to the above examples, you can also take take facts you find and turn them into challenge and trivia questions. This will get your audience engaged with your viral content, no matter where you post it.
And don’t forget Quizzes! They are one of the No 1 reasons for viral content taking off. One of the most popular articles in the New York Times was a quizz!
Now, let’s look at where you can find the data to create content that has the best chance of becoming viral content.
Sources of Statistics and Studies for Viral Content
#1: Your Customers
Let’s start with the most obvious source of data for your content – your customers. Depending on the type of product or service you offer, there’s a good chance you have some interesting data that would draw potential and current customers in.
It may be an interesting insight you can find when analysing your customer database or something you can extract by surveying your customers. The key is to asking the right questions of your customers.
#2: PubMed Central
Think you can link your product or service to a health benefit? Try searching for keywords related to your business on PubMed Central. This search engine will allow you to comb through research on health, life sciences, and medicine from a variety of sources. This includes the National Institutes of Health, CDC, EPA, FDA, and NASA.
#3: National Bureaus of Statistics
Looking for local statistics? Most countries have a national bureau of statistics that you can locate via Google. These sites typically house information about a country’s economy, education, environment, government, health, industries, labor, and people. For instance, in Australia it’s the Australian Bureau of Statistics.
#4: National and Industry Associations
To find statistics related to a specific niche, try local, national, and industry-specific associations. Many will have sections on their website for research, statistics, and studies. The National Association of Realtors real estate statistics page (US-based data), for example, has statistics on the demographics of real estate professionals, consumer trends for home buyers, profiles of home sellers, and technology. And here’s a great list of property research sites for Australia.
The National Funeral Directors Association (US-based data), on the other hand, has a statistics page about funeral home ownership and the average cost of funerals.
Whatever your industry is, there’s usually an association you can turn to for data!
#5: Statista
Statista is a research portal with over one million statistics from over 18,000 sources. They offer free and premium (paid) reports that offer insights into advertising, brands, consumer goods, industries, internet, marketing, retail, society, sports, technology, transportation, and travel.
You can peruse their free reports or subscribe to their premium membership (starting at $49 per month) for access to premium statistics, market forecasts, industry reports, and more.
#6: Small Business Administration
The Small Business Administration has a page for entrepreneurs with resources where you can find data for market research. This US-based data includes general business data and statistics, demographics, consumer statistics, economic indicators, employment statistics, income and earnings, money and interest rates, production and sales statistics, and trade statistics.
#7: Use a Research Center
Check in your country or for government organisations that combine a number of research sources. For example, Research Data Australia allows you to find, access and re-use data for research from over 100 Australian research organisations, government agencies and cultural institutions. Tourism Research Australia is another example of this.
The Pew Research Center in the US, conducts public polls and demographics research on global attitudes, the internet, journalism, media, news, public life, religion, technology, and US politics. You can use the search box on their website to find out if there are publications and datasets that relate to your products and services within these categories.
#8: Nielsen
Nielsen studies consumers in over 100 countries to provide businesses with insights into what people watch and buy. You can browse through categories for consumer, digital, entertainment, global, innovation, media, and perspectives or use the search box to find insights specific to your products and services by keyword.
#9: ComScore
For B2B companies catering products and services to marketers and advertisers, ComScore is a great resource for research on advertising, commerce, cross-platform, digital media, mobile, movies, social, and video.
You’ll find data that aligns with specific industries including automotive, education, energy, entertainment, finance, government, healthcare, manufacturing, pharmaceutical, retail, sports, technology, telecommunications, and travel.
You can also use the search box to find marketing and advertising data specific to keywords for your business’s products and services.
#10: SimilarWeb
SimilarWeb is a source for free and paid data derived from website traffic and app usage. Free users of SimilarWeb can browse website traffic data including average monthly visitors, traffic by country, traffic sources, and audience interests. They can also browse mobile app data including (based on platform) number of installs, number of ratings, global rank, rank by country, rank by category, traffic sources, and audience interests.
#11: Google
While Google can help you find great statistics for your content, you have to use it with diligence. In some cases, you’ll find statistical round up articles, some of which may or may not link to the data’s original source. If you can’t get back to the original source for the statistic, Google it to find other mentions of the statistic (hopefully with a link) or the originating research or study.
Be sure to read the original to determine if the statistic you found is valid and useful to your content. For example, a statistic pulled from a survey of 100 people in one city may not be as convincing as a statistic from a survey of thousands of people worldwide.
Phew, that’s a lot of data.
But at least you now have some great sources of statistics and studies to refer to! Use them when you need to create some data-driven content (to give it the best shot of going viral!).
Now What?
Once you have your data, round it up into a visually appealing piece of content! Try creating one of the following:
- An engaging, shareable social media image -use text over the image to add context, or add the data information in the caption. Just like the examples above.
- A blog post with shareable, data-driven images.
- An infographic – if you are not skilled at producing infographics or you have a limited budget, then use a infographic template.
- A SlideShare presentation – share it on SlideShare or Linkedin. B2B audiences love data-driven content and share it like crazy.
Over to You
Are you creating data-driven content? Use some of these resources and get started!